Request a Diagnostic Conversation

Healthcare Providers and Health Systems

When Patient Volume Stops Translating Into Margin

Patient volume is up. Referrals are strong, service lines are expanding, and patient activity looks healthy across the board.

Then finance is asked what actually happened to margin this quarter, and the honest answer takes longer to reach than it should. Billed revenue is climbing, but realised reimbursement, what's actually collected after contracts, denials, and payment variance, tells a less certain story. Cost-to-serve varies by service line in ways leadership may not yet be able to decompose consistently.

Whether volume growth is translating into real financial strength isn't something leadership can currently answer with confidence.

Signal 1

Volume up, margin unclear

Patient activity and billed revenue are climbing, with no reliable decomposition of what that means for realised margin

Signal 2

Payer mix impact, isolated

The effect of payer mix shifts is understood in aggregate, but not always connected consistently to specific service lines, sites of care, or case types

Signal 3

Denials resolved, patterns missed

Individual denials get worked and resolved, but the recurring causes behind them, by payer, service line, or coding pattern, often go untraced

Signal 4

Cost-to-serve as an average, not a reality

Cost-to-serve is typically reported in aggregate, not decomposed by service line or case complexity, where the real margin variation usually lives

Leadership Question

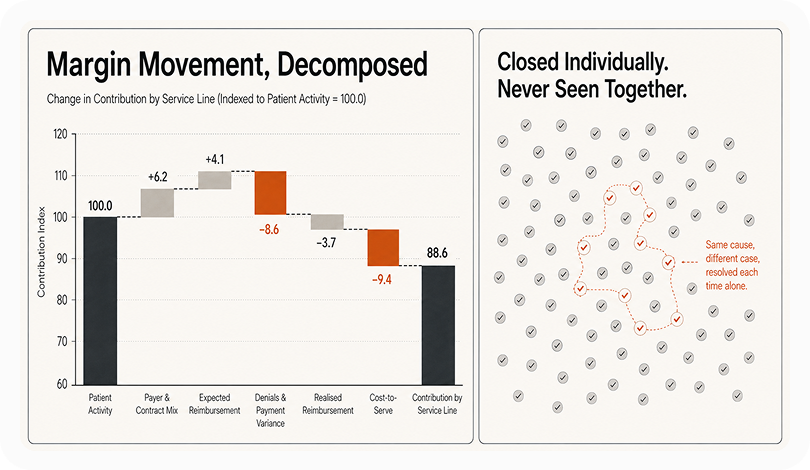
When margin moves, can we say how much came from payer mix, denials, cost-to-serve, or reimbursement rate, or only that it moved?

What's Actually Breaking

Reimbursement Realisation Has No Agreed Decomposition

Billed revenue, contractual allowances, payer mix, and denials sit across the EHR, billing systems, and individual payer contracts. Assembling them into one view of what's actually realised, and why, is not always done consistently.

Cost-to-Serve Is Measured in Aggregate, Not by Service Line

Cost is often tracked at the encounter or department level, without a clear view of how it varies by service line, case complexity, or site of care.

Denials Get Resolved Individually, Rarely Traced to a Root Cause

A denial gets worked and often overturned. Whether it recurs because of a specific payer's policy, a coding pattern, or a documentation gap is inconsistently tracked back to its source.

Request a Diagnostic Conversation

Why the obvious fix falls short

A Bigger Revenue Cycle Dashboard

Shows billed revenue, collections, and denial volume clearly, but rarely decomposes margin movement into its actual drivers.

Request a Diagnostic Conversation

Hiring More Denial Management Staff

Addresses the immediate case volume, but doesn't reduce the recurring causes generating denials in the first place.

Decompose the Movement

Examine and reconcile each period's margin shift across patient activity, payer and contract mix, expected reimbursement, denials and payment variance, realised reimbursement, and cost-to-serve, using agreed rules rather than aggregate averages.

Flag Where Attribution Relies on Assumption

Where a step depends on an assumption rather than confirmed data, that's flagged explicitly, early enough for finance and revenue-cycle leaders to investigate before the pattern becomes materially larger.

Assign Accountability Before the Next Cycle

ccountability for improving the weakest inputs is clarified before the next reporting cycle.

