Request a Diagnostic Conversation

Manufacturing

When Production Output Grows and True Cost-Per-Unit Quietly Outpaces It

Production output is up. Lines are running at higher utilisation, new shifts have been added, and on paper the plant looks more efficient than it did a year ago.

Then finance is asked what that growth actually did to true cost-per-unit, and the honest answer takes longer to reach than it should. Scrap, rework, and downtime cost aren't always reconciled consistently against the specific run or line that generated them.

Whether output growth is translating into durable margin, or simply adding volume at a cost leadership hasn't fully priced, isn't something that can currently be answered with confidence.

Signal 1

Output up, cost-per-unit unclear

Production volume is climbing, with no reliable decomposition of what that means for true cost-per-unit by line or shift

Signal 2

Scrap and rework, reconciled inconsistently

Scrap and rework are tracked, but not always reconciled consistently against the specific run, shift, or material batch that caused them

Signal 3

Downtime logged, cause unclear

Downtime minutes are recorded, but the specific driver, a changeover, a breakdown, a material shortage, isn't always captured with the same consistency

Signal 4

A month-end reconciliation

True cost-per-unit figures for a line or product arrive later than the output volume figures they're meant to explain

Leadership Question

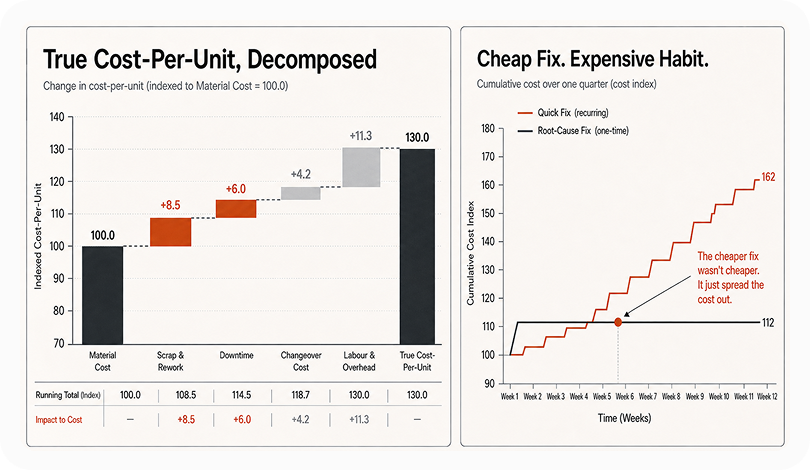
When cost-per-unit moves, can we say how much came from scrap, rework, downtime, or material cost, or only that it moved?

What's Actually Breaking

True Cost-Per-Unit Has No Agreed Decomposition

Material cost, scrap, rework, and downtime sit across the MES, ERP, and shop floor logs. Assembling them into one view of what a unit actually costs to produce, on a given line and shift, is not always done consistently.

Scrap and Rework Cost Is Rarely Reconciled Against Its Root Cause

Scrap and rework are tracked, often carefully, but the real gap isn't visibility into the volume alone, it's that it's not consistently reconciled against the specific line, shift, and material batch in one view.

Downtime and Its Financial Impact Are Tracked Separately

Downtime minutes are logged by maintenance. Cost impact is calculated by finance, often on a different cycle. Whether a specific downtime cause justifies its cost, or whether a cheaper fix is quietly costing more in recurring downtime, is not always visible in one place.

Request a Diagnostic Conversation

Why the obvious fix falls short

A Bigger Production Dashboard

Shows output and downtime figures clearly, but rarely decomposes cost-per-unit into its actual line-level drivers.

Request a Diagnostic Conversation

Broadly Cutting Changeover Time

Addresses one cost driver broadly, without necessarily addressing the specific line or product where cost-per-unit is actually weakest.

Decompose the Movement

Break each period's cost-per-unit across material cost, scrap and rework, downtime, changeover cost, and labour and overhead, using agreed rules rather than siloed reporting.

Flag Where Attribution Relies on Assumption

This isn't a promise of complete certainty, it's a view of the most material cost drivers with a clear flag on where attribution still depends on assumption.

Assign Accountability Before the Next Cycle

Accountability for improving the weakest inputs is clarified before the next reporting cycle.

